| Color | Trajectory Frequency |
| 0 < Freq. ≤ 10 | |
| 10 < Freq. ≤ 20 | |
| 20 < Freq. ≤ 30 | |
| 30 < Freq. ≤ 40 | |
| 40 < Freq. ≤ 50 | |
| 50 < Freq. ≤ 60 | |
| 60 < Freq. ≤ 70 | |
| 70 < Freq. ≤ 80 | |
| 80 < Freq. ≤ 90 | |
| 90 < Freq. ≤ 100 |
| Index | Node1 | Node2 | Freq | Hub1? | Hub2? | Community | Value1 | Value2 |
|---|---|---|---|---|---|---|---|---|
| 1 | A:A:K2 | A:A:P1 | 100 | No | No | 0 | 0 | 0 |
| 2 | A:A:K2 | A:A:P3 | 100 | No | No | 0 | 0 | 0 |
| 3 | A:A:D5 | A:A:K2 | 90.28 | No | No | 0 | 0 | 0 |
| 4 | A:A:G4 | A:A:P3 | 100 | No | No | 0 | 0 | 0 |
| 5 | A:A:K91 | A:A:P3 | 75.56 | Yes | No | 0 | 0 | 0 |
| 6 | A:A:D5 | A:A:I6 | 99.89 | No | No | 0 | 0 | 0 |
| 7 | A:A:F7 | A:A:I6 | 97.25 | Yes | No | 0 | 0 | 0 |
| 8 | A:A:E8 | A:A:F7 | 67.53 | No | Yes | 0 | 0 | 0 |
| 9 | A:A:F7 | A:A:L89 | 99.98 | Yes | No | 0 | 0 | 0 |
| 10 | A:A:F7 | A:A:K91 | 78.42 | Yes | Yes | 0 | 0 | 0 |
| 11 | A:A:E8 | A:A:V9 | 99.86 | No | Yes | 1 | 0 | 0 |
| 12 | A:A:E8 | A:A:H86 | 87.6 | No | Yes | 1 | 0 | 0 |
| 13 | A:A:H86 | A:A:V9 | 58.55 | Yes | Yes | 1 | 0 | 0 |
| 14 | A:A:L87 | A:A:V9 | 83.67 | No | Yes | 1 | 0 | 0 |
| 15 | A:A:E10 | A:A:L11 | 96.75 | No | No | 0 | 0 | 0 |
| 16 | A:A:K13 | A:A:N14 | 55.92 | Yes | No | 0 | 0 | 0 |
| 17 | A:A:K13 | A:A:T81 | 98.37 | Yes | No | 0 | 0 | 0 |
| 18 | A:A:D15 | A:A:N14 | 100 | No | No | 0 | 0 | 0 |
| 19 | A:A:D15 | A:A:N16 | 99.37 | No | No | 0 | 0 | 0 |
| 20 | A:A:L18 | A:A:S17 | 93.61 | No | No | 0 | 0 | 0 |
| 21 | A:A:I20 | A:A:S21 | 100 | No | No | 0 | 0 | 0 |
| 22 | A:A:S21 | A:A:V22 | 100 | No | No | 0 | 0 | 0 |
| 23 | A:A:T23 | A:A:V22 | 100 | No | No | 0 | 0 | 0 |
| 24 | A:A:H71 | A:A:V22 | 56.64 | No | No | 0 | 0 | 0 |
| 25 | A:A:G24 | A:A:T23 | 98.03 | No | No | 0 | 0 | 0 |
| 26 | A:A:N27 | A:A:V26 | 83.22 | No | No | 0 | 0 | 0 |
| 27 | A:A:N27 | A:A:T28 | 100 | No | No | 0 | 0 | 0 |
| 28 | A:A:S29 | A:A:T28 | 81.15 | No | No | 0 | 0 | 0 |
| 29 | A:A:S29 | A:A:V30 | 100 | No | No | 0 | 0 | 0 |
| 30 | A:A:R31 | A:A:V30 | 99.97 | No | No | 0 | 0 | 0 |
| 31 | A:A:H32 | A:A:R31 | 78.65 | No | No | 0 | 0 | 0 |
| 32 | A:A:R31 | A:A:Y36 | 53.53 | No | Yes | 0 | 0 | 0 |
| 33 | A:A:I35 | A:A:Y36 | 100 | No | Yes | 0 | 0 | 0 |
| 34 | A:A:I35 | A:A:V58 | 89.13 | No | No | 0 | 0 | 0 |
| 35 | A:A:V37 | A:A:Y36 | 100 | No | Yes | 0 | 0 | 0 |
| 36 | A:A:K38 | A:A:V37 | 98.26 | No | No | 0 | 0 | 0 |
| 37 | A:A:I41 | A:A:V40 | 100 | No | No | 0 | 0 | 0 |
| 38 | A:A:I41 | A:A:P42 | 100 | No | Yes | 0 | 0 | 0 |
| 39 | A:A:P42 | A:A:Q43 | 99.47 | Yes | No | 0 | 0 | 0 |
| 40 | A:A:E47 | A:A:P42 | 89.55 | No | Yes | 0 | 0 | 0 |
| 41 | A:A:E47 | A:A:S48 | 97.18 | No | No | 0 | 0 | 0 |
| 42 | A:A:D49 | A:A:S48 | 86.98 | No | No | 0 | 0 | 0 |
| 43 | A:A:D49 | A:A:R51 | 100 | No | No | 0 | 0 | 0 |
| 44 | A:A:I52 | A:A:R51 | 100 | No | No | 0 | 0 | 0 |
| 45 | A:A:H53 | A:A:I52 | 67.55 | Yes | No | 0 | 0 | 0 |
| 46 | A:A:I52 | A:A:L89 | 57.65 | No | No | 0 | 0 | 0 |
| 47 | A:A:H53 | A:A:K54 | 100 | Yes | No | 0 | 0 | 0 |
| 48 | A:A:D56 | A:A:H53 | 74.84 | No | Yes | 0 | 0 | 0 |
| 49 | A:A:D56 | A:A:K91 | 94.54 | No | Yes | 0 | 0 | 0 |
| 50 | A:A:R57 | A:A:V58 | 100 | No | No | 2 | 0 | 0 |
| 51 | A:A:L59 | A:A:R57 | 76.83 | No | No | 2 | 0 | 0 |
| 52 | A:A:E90 | A:A:R57 | 59.56 | No | No | 0 | 0 | 0 |
| 53 | A:A:L59 | A:A:V58 | 99.84 | No | No | 2 | 0 | 0 |
| 54 | A:A:N62 | A:A:V61 | 99.99 | No | Yes | 0 | 0 | 0 |
| 55 | A:A:V61 | A:A:V64 | 99.71 | Yes | No | 0 | 0 | 0 |
| 56 | A:A:S65 | A:A:V64 | 100 | No | No | 0 | 0 | 0 |
| 57 | A:A:L66 | A:A:S65 | 91.58 | No | No | 0 | 0 | 0 |
| 58 | A:A:E67 | A:A:L66 | 91.3 | No | No | 0 | 0 | 0 |
| 59 | A:A:H71 | A:A:T70 | 99.99 | No | No | 0 | 0 | 0 |
| 60 | A:A:H71 | A:A:K72 | 99.74 | No | No | 0 | 0 | 0 |
| 61 | A:A:K72 | A:A:Q73 | 99.72 | No | No | 0 | 0 | 0 |
| 62 | A:A:E76 | A:A:V75 | 100 | Yes | No | 0 | 0 | 0 |
| 63 | A:A:E76 | A:A:T77 | 100 | Yes | No | 0 | 0 | 0 |
| 64 | A:A:E76 | A:A:R79 | 55.58 | Yes | No | 3 | 0 | 0 |
| 65 | A:A:E76 | A:A:N80 | 54.99 | Yes | No | 3 | 0 | 0 |
| 66 | A:A:L78 | A:A:T77 | 99.41 | No | No | 0 | 0 | 0 |
| 67 | A:A:L78 | A:A:R79 | 98.4 | No | No | 0 | 0 | 0 |
| 68 | A:A:N80 | A:A:R79 | 90.1 | No | No | 3 | 0 | 0 |
| 69 | A:A:N80 | A:A:T81 | 100 | No | No | 0 | 0 | 0 |
| 70 | A:A:Q83 | A:A:V84 | 92.1 | No | No | 0 | 0 | 0 |
| 71 | A:A:V84 | A:A:V85 | 100 | No | No | 0 | 0 | 0 |
| 72 | A:A:H86 | A:A:V85 | 77.98 | Yes | No | 0 | 0 | 0 |
| 73 | A:A:H86 | A:A:L87 | 99.93 | Yes | No | 1 | 0 | 0 |
| 74 | A:A:L88 | A:A:L89 | 99.96 | No | No | 0 | 0 | 0 |
| 75 | A:A:E90 | A:A:K91 | 99.99 | No | Yes | 0 | 0 | 0 |
| 76 | A:A:Q93 | A:A:S94 | 83.91 | No | No | 0 | 0 | 0 |
| 77 | A:A:E10 | A:A:V9 | 11.1 | No | Yes | 0 | 0 | 0 |
| 78 | A:A:K13 | A:A:Q83 | 40.01 | Yes | No | 0 | 0 | 0 |
| 79 | A:A:T23 | A:A:Y36 | 27.05 | No | Yes | 0 | 0 | 0 |
| 80 | A:A:G33 | A:A:V30 | 30.16 | No | No | 0 | 0 | 0 |
| 81 | A:A:G92 | A:A:K91 | 20.33 | No | Yes | 0 | 0 | 0 |
| 82 | A:A:D49 | A:A:G50 | 24.27 | No | No | 0 | 0 | 0 |
| 83 | A:A:G82 | A:A:T81 | 0.77 | No | No | 0 | 0 | 0 |
| 84 | A:A:G63 | A:A:V61 | 0 | No | Yes | 0 | 0 | 0 |
| 85 | A:A:G44 | A:A:P42 | 0 | No | Yes | 0 | 0 | 0 |
| 86 | A:A:G55 | A:A:K54 | 0.09 | No | No | 0 | 0 | 0 |
| 87 | A:A:G19 | A:A:L18 | 0 | No | No | 0 | 0 | 0 |
| 88 | A:A:A74 | A:A:V75 | 1.51 | No | No | 0 | 0 | 0 |
| 89 | A:A:A60 | A:A:V61 | 0.09 | No | Yes | 0 | 0 | 0 |
| 90 | A:A:A69 | A:A:T70 | 0.03 | No | No | 0 | 0 | 0 |
| 91 | A:A:E67 | A:A:G68 | 0.22 | No | No | 0 | 0 | 0 |
| 92 | A:A:A39 | A:A:S21 | 0 | No | No | 0 | 0 | 0 |
| 93 | A:A:A12 | A:A:K13 | 0 | No | Yes | 0 | 0 | 0 |
| 94 | A:A:A60 | A:A:L88 | 0.04 | No | No | 0 | 0 | 0 |
| 95 | A:A:A46 | A:A:E47 | 0 | No | No | 0 | 0 | 0 |
| 96 | A:A:G34 | A:A:Y36 | 17.83 | No | Yes | 0 | 0 | 0 |
| 97 | A:A:L11 | A:A:L18 | 9.05 | No | No | 0 | 0 | 0 |
| 98 | A:A:G25 | A:A:I35 | 0 | No | No | 0 | 0 | 0 |
| 99 | A:A:A45 | A:A:S48 | 0 | No | No | 0 | 0 | 0 |
| 100 | A:A:H53 | A:A:S94 | 16.4 | Yes | No | 0 | 0 | 0 |
Index: link id, click on each number to highlight the corresponding link in the 3D visualization.
Node1 Node2: the two nodes of the corresponding link.
Freq: the trajectory frequency of this link.
Hub1?, Hub2?: "Yes" if the corresponding node has more than 3 links, otherwise "No".
Community: the id of the community the link belong to, otherwise 0.
Value1, Value2: these columns report the values present in the user submitted external values file (if any).
| Color | Trajectory Frequency |
| 0 < Freq. ≤ 10 | |
| 10 < Freq. ≤ 20 | |
| 20 < Freq. ≤ 30 | |
| 30 < Freq. ≤ 40 | |
| 40 < Freq. ≤ 50 | |
| 50 < Freq. ≤ 60 | |
| 60 < Freq. ≤ 70 | |
| 70 < Freq. ≤ 80 | |
| 80 < Freq. ≤ 90 | |
| 90 < Freq. ≤ 100 |
| Index | Hub | Freq | Num Of Links | Community | Value |
|---|---|---|---|---|---|
| 1 | A:A:F7 | 74.55 | 4 | 0 | 0 |
| 2 | A:A:V9 | 50 | 4 | 1 | 0 |
| 3 | A:A:K13 | 67.61 | 4 | 0 | 0 |
| 4 | A:A:Y36 | 83.12 | 5 | 0 | 0 |
| 5 | A:A:P42 | 82.67 | 4 | 0 | 0 |
| 6 | A:A:H53 | 50 | 4 | 0 | 0 |
| 7 | A:A:V61 | 97.36 | 4 | 0 | 0 |
| 8 | A:A:E76 | 38.9 | 4 | 3 | 0 |
| 9 | A:A:H86 | 49.8 | 4 | 1 | 0 |
| 10 | A:A:K91 | 96.44 | 5 | 0 | 0 |
Index: hub id, click on each number to highlight the corresponding hub in the 3D visualization.
Hub: the hub being considered.
Freq: the trajectory frequency of the corresponding hub.
Num Of Links: the number of links of the corresponding hub.
Community: the id of the community the link belong to, otherwise 0.
Value: this column reports the value present in the user submitted external values file (if any).
| Color | Relative Recurrence (%) |
| 0 < rr ≤ 10 | |
| 10 < rr ≤ 20 | |
| 20 < rr ≤ 30 | |
| 30 < rr ≤ 40 | |
| 40 < rr ≤ 50 | |
| 50 < rr ≤ 60 | |
| 60 < rr ≤ 70 | |
| 70 < rr ≤ 80 | |
| 80 < rr ≤ 90 | |
| 90 < rr ≤ 100 |
| Index | Node1 | Node2 | Recurrency | Freq | Hub1? | Hub2? | Community | Value1 | Value2 |
|---|---|---|---|---|---|---|---|---|---|
| 1 | A:A:F7 | A:A:K91 | 88.2948 | 78.42 | Yes | Yes | 0 | 0 | 0 |
| 2 | A:A:E8 | A:A:F7 | 88.6802 | 67.53 | No | Yes | 0 | 0 | 0 |
| 3 | A:A:F7 | A:A:L89 | 74.422 | 99.98 | Yes | No | 0 | 0 | 0 |
| 4 | A:A:E8 | A:A:V9 | 22.736 | 99.86 | No | Yes | 1 | 0 | 0 |
| 5 | A:A:E8 | A:A:H86 | 63.3911 | 87.6 | No | Yes | 1 | 0 | 0 |
| 6 | A:A:E10 | A:A:V9 | 21.3391 | 11.1 | No | Yes | 0 | 0 | 0 |
| 7 | A:A:K13 | A:A:Q83 | 53.6127 | 40.01 | Yes | No | 0 | 0 | 0 |
| 8 | A:A:Q83 | A:A:V84 | 57.1773 | 92.1 | No | No | 0 | 0 | 0 |
| 9 | A:A:V84 | A:A:V85 | 60.5491 | 100 | No | No | 0 | 0 | 0 |
| 10 | A:A:H86 | A:A:V85 | 63.8247 | 77.98 | Yes | No | 0 | 0 | 0 |
| 11 | A:A:K13 | A:A:T81 | 36.4162 | 98.37 | Yes | No | 0 | 0 | 0 |
| 12 | A:A:T23 | A:A:V22 | 39.9326 | 100 | No | No | 0 | 0 | 0 |
| 13 | A:A:T23 | A:A:Y36 | 46.869 | 27.05 | No | Yes | 0 | 0 | 0 |
| 14 | A:A:I35 | A:A:Y36 | 87.7649 | 100 | No | Yes | 0 | 0 | 0 |
| 15 | A:A:I35 | A:A:V58 | 91.0405 | 89.13 | No | No | 0 | 0 | 0 |
| 16 | A:A:R57 | A:A:V58 | 92.8709 | 100 | No | No | 2 | 0 | 0 |
| 17 | A:A:E90 | A:A:R57 | 97.1098 | 59.56 | No | No | 0 | 0 | 0 |
| 18 | A:A:E90 | A:A:K91 | 100 | 99.99 | No | Yes | 0 | 0 | 0 |
| 19 | A:A:H71 | A:A:V22 | 23.2659 | 56.64 | No | No | 0 | 0 | 0 |
| 20 | A:A:R31 | A:A:Y36 | 35.4528 | 53.53 | No | Yes | 0 | 0 | 0 |
| 21 | A:A:R31 | A:A:V30 | 27.9865 | 99.97 | No | No | 0 | 0 | 0 |
| 22 | A:A:S29 | A:A:V30 | 20.183 | 100 | No | No | 0 | 0 | 0 |
| 23 | A:A:E47 | A:A:P42 | 24.2293 | 89.55 | No | Yes | 0 | 0 | 0 |
| 24 | A:A:E47 | A:A:S48 | 35.8863 | 97.18 | No | No | 0 | 0 | 0 |
| 25 | A:A:D49 | A:A:S48 | 45.183 | 86.98 | No | No | 0 | 0 | 0 |
| 26 | A:A:D49 | A:A:R51 | 53.9981 | 100 | No | No | 0 | 0 | 0 |
| 27 | A:A:I52 | A:A:R51 | 59.4412 | 100 | No | No | 0 | 0 | 0 |
| 28 | A:A:H53 | A:A:I52 | 31.1657 | 67.55 | Yes | No | 0 | 0 | 0 |
| 29 | A:A:D56 | A:A:H53 | 32.8516 | 74.84 | No | Yes | 0 | 0 | 0 |
| 30 | A:A:D56 | A:A:K91 | 34.9229 | 94.54 | No | Yes | 0 | 0 | 0 |
| 31 | A:A:I52 | A:A:L89 | 50.4817 | 57.65 | No | No | 0 | 0 | 0 |
| 32 | A:A:L88 | A:A:L89 | 37.9576 | 99.96 | No | No | 0 | 0 | 0 |
| 33 | A:A:A60 | A:A:L88 | 34.0559 | 0.04 | No | No | 0 | 0 | 0 |
| 34 | A:A:A60 | A:A:V61 | 31.6474 | 0.09 | No | Yes | 0 | 0 | 0 |
| 35 | A:A:V61 | A:A:V64 | 20.8092 | 99.71 | Yes | No | 0 | 0 | 0 |
| 36 | A:A:N80 | A:A:T81 | 29.9133 | 100 | No | No | 0 | 0 | 0 |
Index: link id, click on each number to highlight the corresponding link in the 3D visualization.
Node1 Node2: the two nodes of the corresponding link.
Recurrency: the relative recurrency in the filtered pool of shortest paths.
Freq: the trajectory frequency of this link.
Hub1?, Hub2?: "Yes" if the corresponding node has more than 3 links, otherwise "No".
Community: the id of the community the link belong to, otherwise 0.
Value1, Value2: these columns report the values present in the user submitted external values file (if any).
| Color | Relative Recurrence (%) |
| 0 < rr ≤ 10 | |
| 10 < rr ≤ 20 | |
| 20 < rr ≤ 30 | |
| 30 < rr ≤ 40 | |
| 40 < rr ≤ 50 | |
| 50 < rr ≤ 60 | |
| 60 < rr ≤ 70 | |
| 70 < rr ≤ 80 | |
| 80 < rr ≤ 90 | |
| 9 < rr ≤ 10 |
Here, those paths that begin and end at given residue pair(s) or that pass through a residue are used to generate a novel metapath. Such a path filtering is particularly recommended if some information on allosteric residues is available. The selection syntax for a residue pair ("Pairs") is C:C:c534,A:A:?600 (the lower-case "c" stands for cytosine and "?" indicates any non standard amino acid or nucleotide residue). Selection of more than one apical residue pair has the following syntax: C:C:c534,A:A:?600,C:C:c534,A:A:E41. Only one residue can be selected as a tail ("Tail"). For midway residue(s), each residue must be separated by a comma as well e.g. A:A:?600,A:A:E41.
| Index | Node1 | Node2 | Recurrency | Freq | Hub1? | Hub2? | Community | Value1 | Value2 |
|---|---|---|---|---|---|---|---|---|---|
| 1 | A:A:E90 | A:A:K91 | 82.9011 | 99.99 | No | Yes | 0 | 0 | 0 |
| 2 | A:A:E90 | A:A:R57 | 81.4425 | 59.56 | No | No | 0 | 0 | 0 |
| 3 | A:A:R57 | A:A:V58 | 79.4165 | 100 | No | No | 2 | 0 | 0 |
| 4 | A:A:I35 | A:A:V58 | 78.6062 | 89.13 | No | No | 0 | 0 | 0 |
| 5 | A:A:I35 | A:A:Y36 | 77.4716 | 100 | No | Yes | 0 | 0 | 0 |
| 6 | A:A:R31 | A:A:Y36 | 59.6434 | 53.53 | No | Yes | 0 | 0 | 0 |
| 7 | A:A:R31 | A:A:V30 | 47.0827 | 99.97 | No | No | 0 | 0 | 0 |
| 8 | A:A:S29 | A:A:V30 | 33.3874 | 100 | No | No | 0 | 0 | 0 |
| 9 | A:A:S29 | A:A:T28 | 25.0405 | 81.15 | No | No | 0 | 0 | 0 |
| 10 | A:A:E47 | A:A:P42 | 38.8169 | 89.55 | No | Yes | 0 | 0 | 0 |
| 11 | A:A:E47 | A:A:S48 | 58.4279 | 97.18 | No | No | 0 | 0 | 0 |
| 12 | A:A:D49 | A:A:S48 | 74.6353 | 86.98 | No | No | 0 | 0 | 0 |
| 13 | A:A:D49 | A:A:R51 | 90.8428 | 100 | No | No | 0 | 0 | 0 |
| 14 | A:A:I52 | A:A:R51 | 100 | 100 | No | No | 0 | 0 | 0 |
| 15 | A:A:H53 | A:A:I52 | 34.4408 | 67.55 | Yes | No | 0 | 0 | 0 |
| 16 | A:A:D56 | A:A:H53 | 33.1442 | 74.84 | No | Yes | 0 | 0 | 0 |
| 17 | A:A:D56 | A:A:K91 | 33.2253 | 94.54 | No | Yes | 0 | 0 | 0 |
| 18 | A:A:I52 | A:A:L89 | 65.8023 | 57.65 | No | No | 0 | 0 | 0 |
| 19 | A:A:F7 | A:A:L89 | 63.3712 | 99.98 | Yes | No | 0 | 0 | 0 |
| 20 | A:A:F7 | A:A:K91 | 54.2139 | 78.42 | Yes | Yes | 0 | 0 | 0 |
| 21 | A:A:E8 | A:A:F7 | 40.3566 | 67.53 | No | Yes | 0 | 0 | 0 |
| 22 | A:A:E8 | A:A:H86 | 28.5251 | 87.6 | No | Yes | 1 | 0 | 0 |
| 23 | A:A:K13 | A:A:Q83 | 20.9887 | 40.01 | Yes | No | 0 | 0 | 0 |
| 24 | A:A:Q83 | A:A:V84 | 22.6094 | 92.1 | No | No | 0 | 0 | 0 |
| 25 | A:A:V84 | A:A:V85 | 24.2301 | 100 | No | No | 0 | 0 | 0 |
| 26 | A:A:H86 | A:A:V85 | 25.8509 | 77.98 | Yes | No | 0 | 0 | 0 |
| 27 | A:A:T23 | A:A:V22 | 21.3938 | 100 | No | No | 0 | 0 | 0 |
| 28 | A:A:T23 | A:A:Y36 | 25.6078 | 27.05 | No | Yes | 0 | 0 | 0 |
Index: link id, click on each number to highlight the corresponding link in the 3D visualization.
Node1 Node2: the two nodes of the corresponding link.
Recurrency: the relative recurrency in the filtered pool of shortest paths.
Freq: the trajectory frequency of this link.
Hub1?, Hub2?: "Yes" if the corresponding node has more than 3 links, otherwise "No".
Community: the id of the community the link belong to, otherwise 0.
Value1, Value2: these columns report the values present in the user submitted external values file (if any).
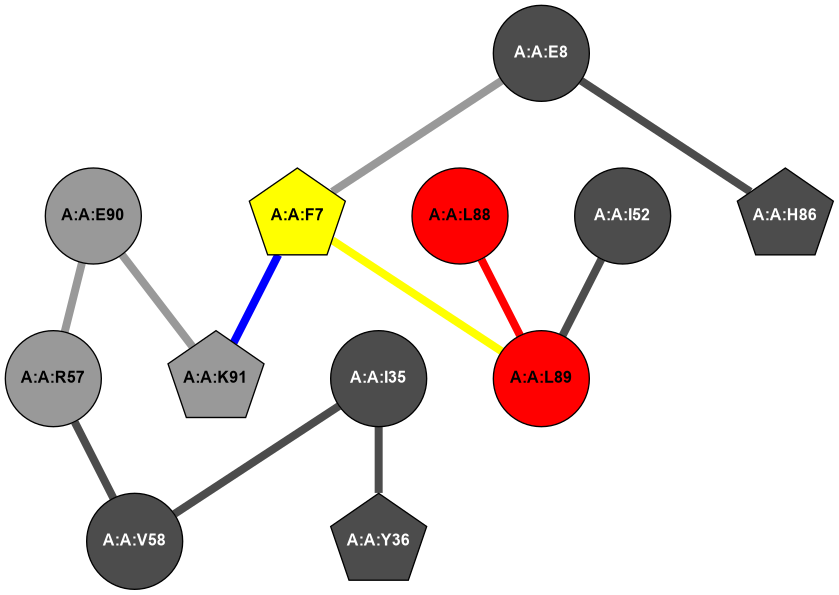
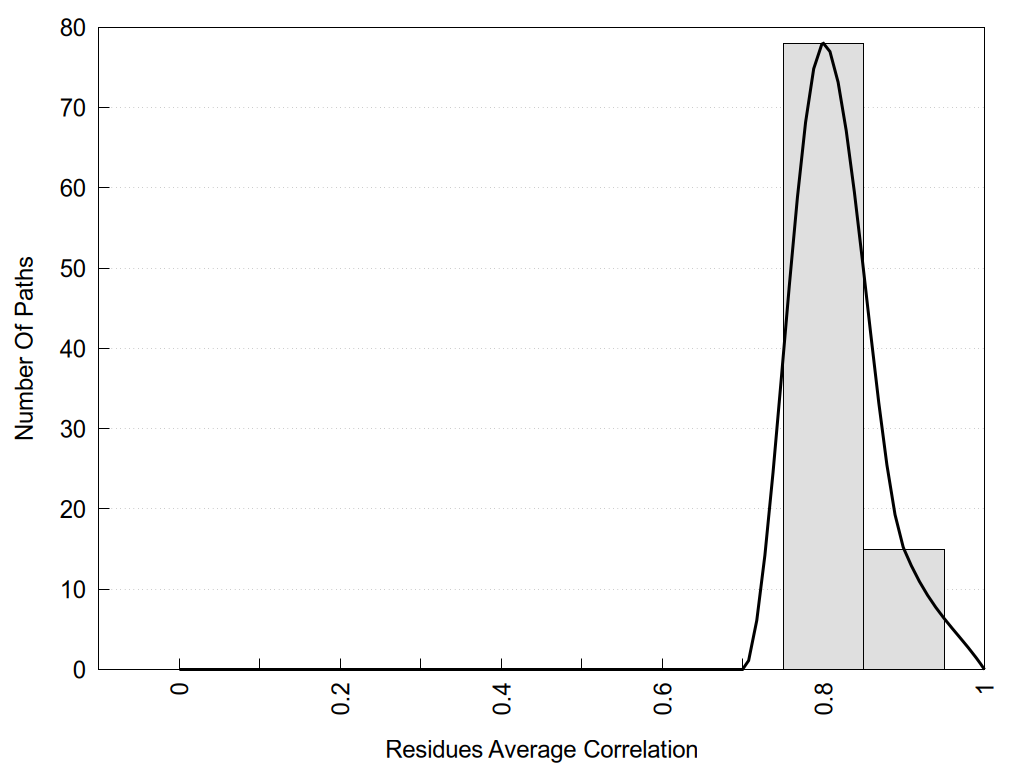
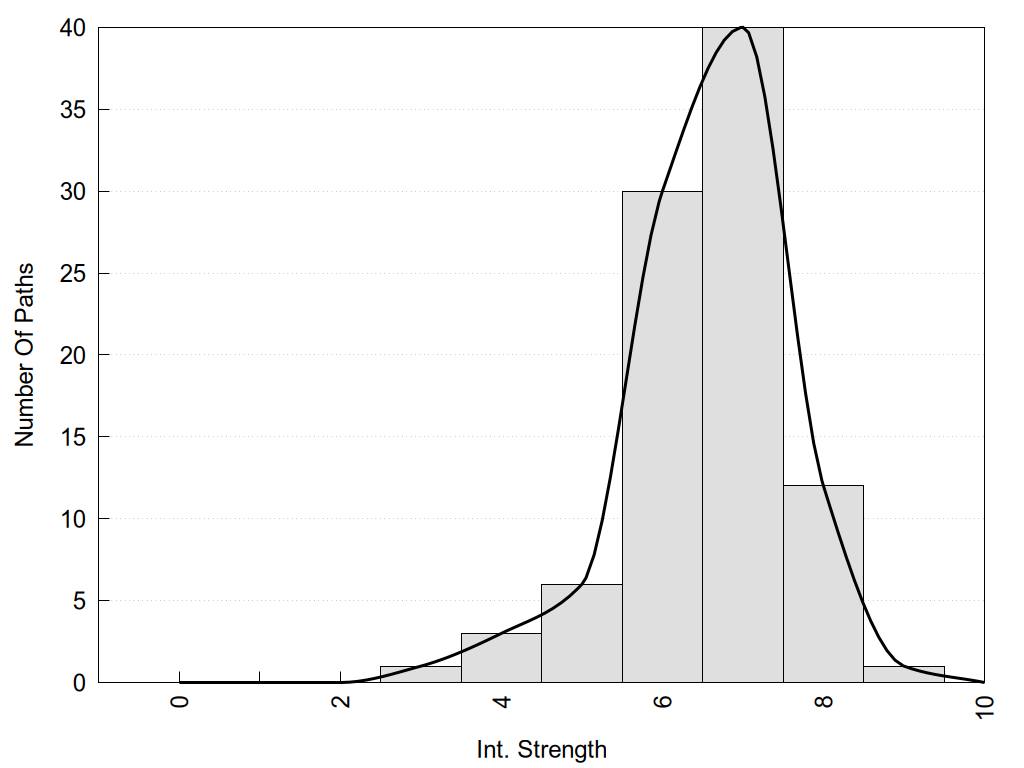
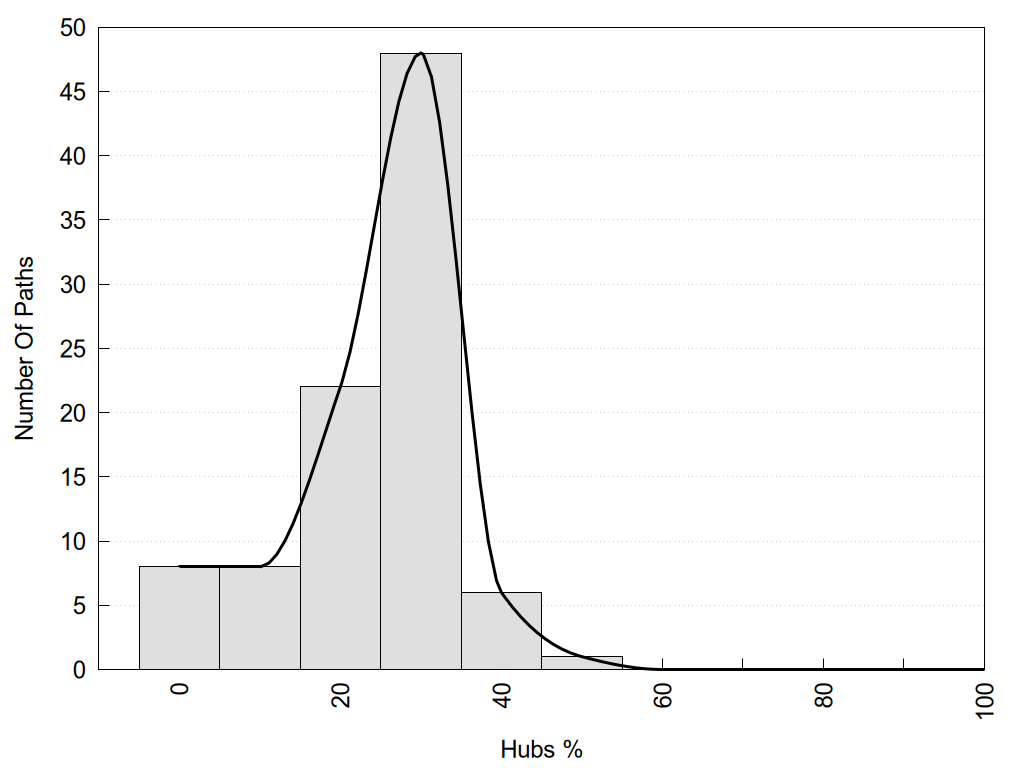
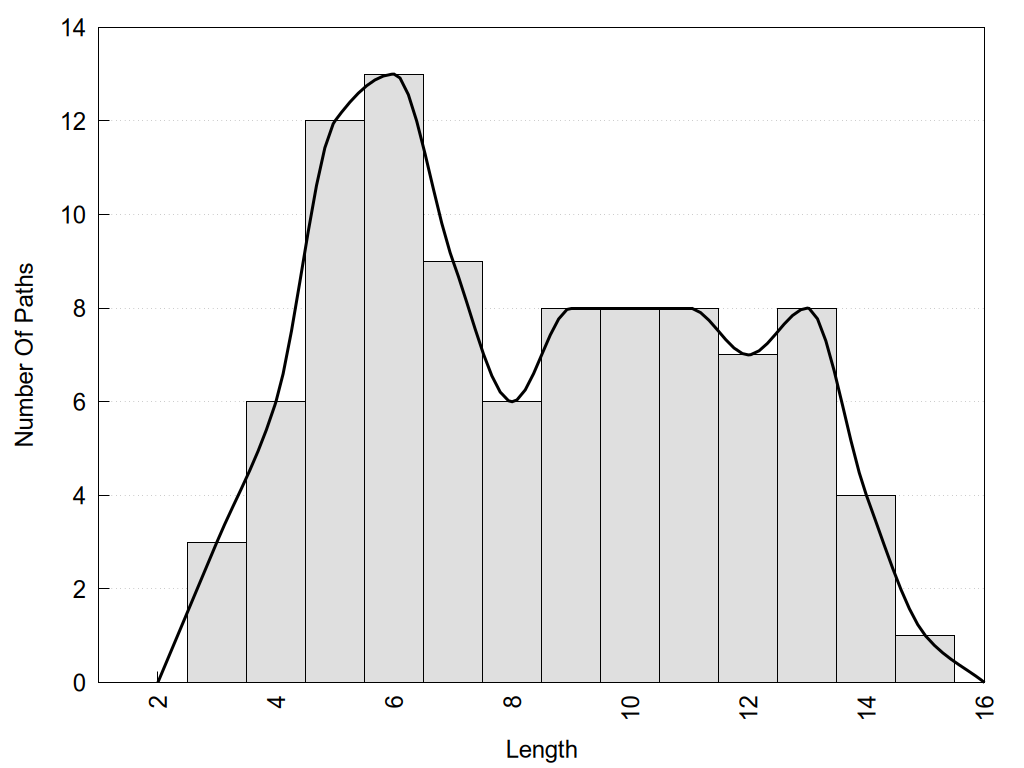
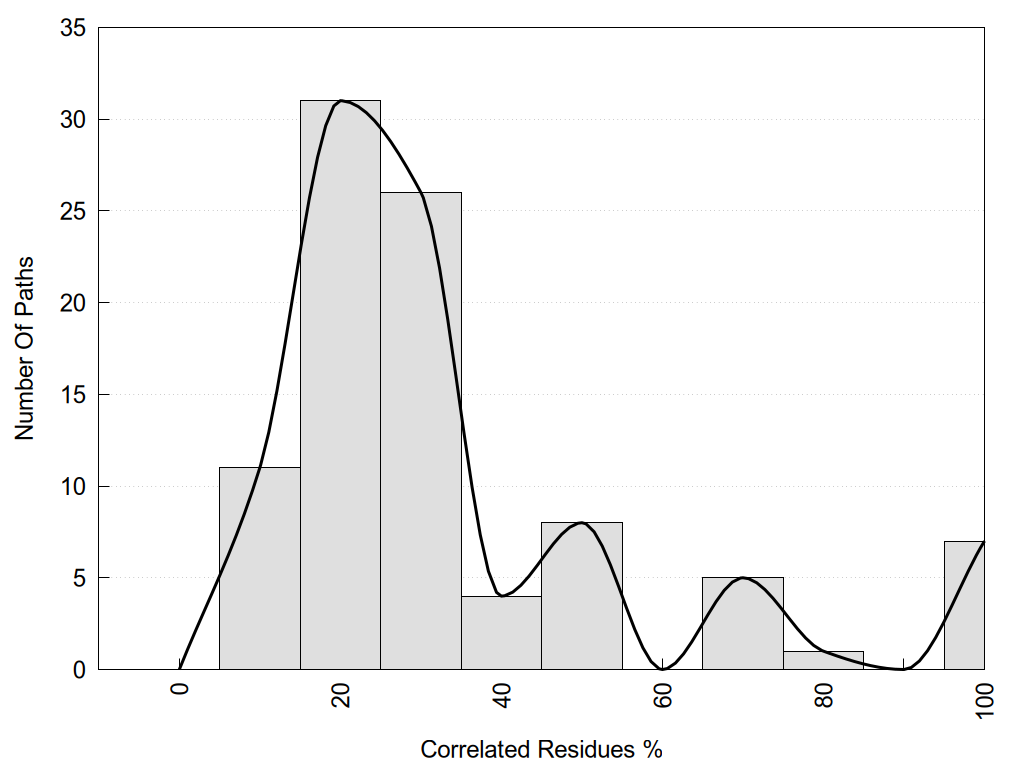
2D representation of the global metapath and histograms of path distribution according to several parameters:
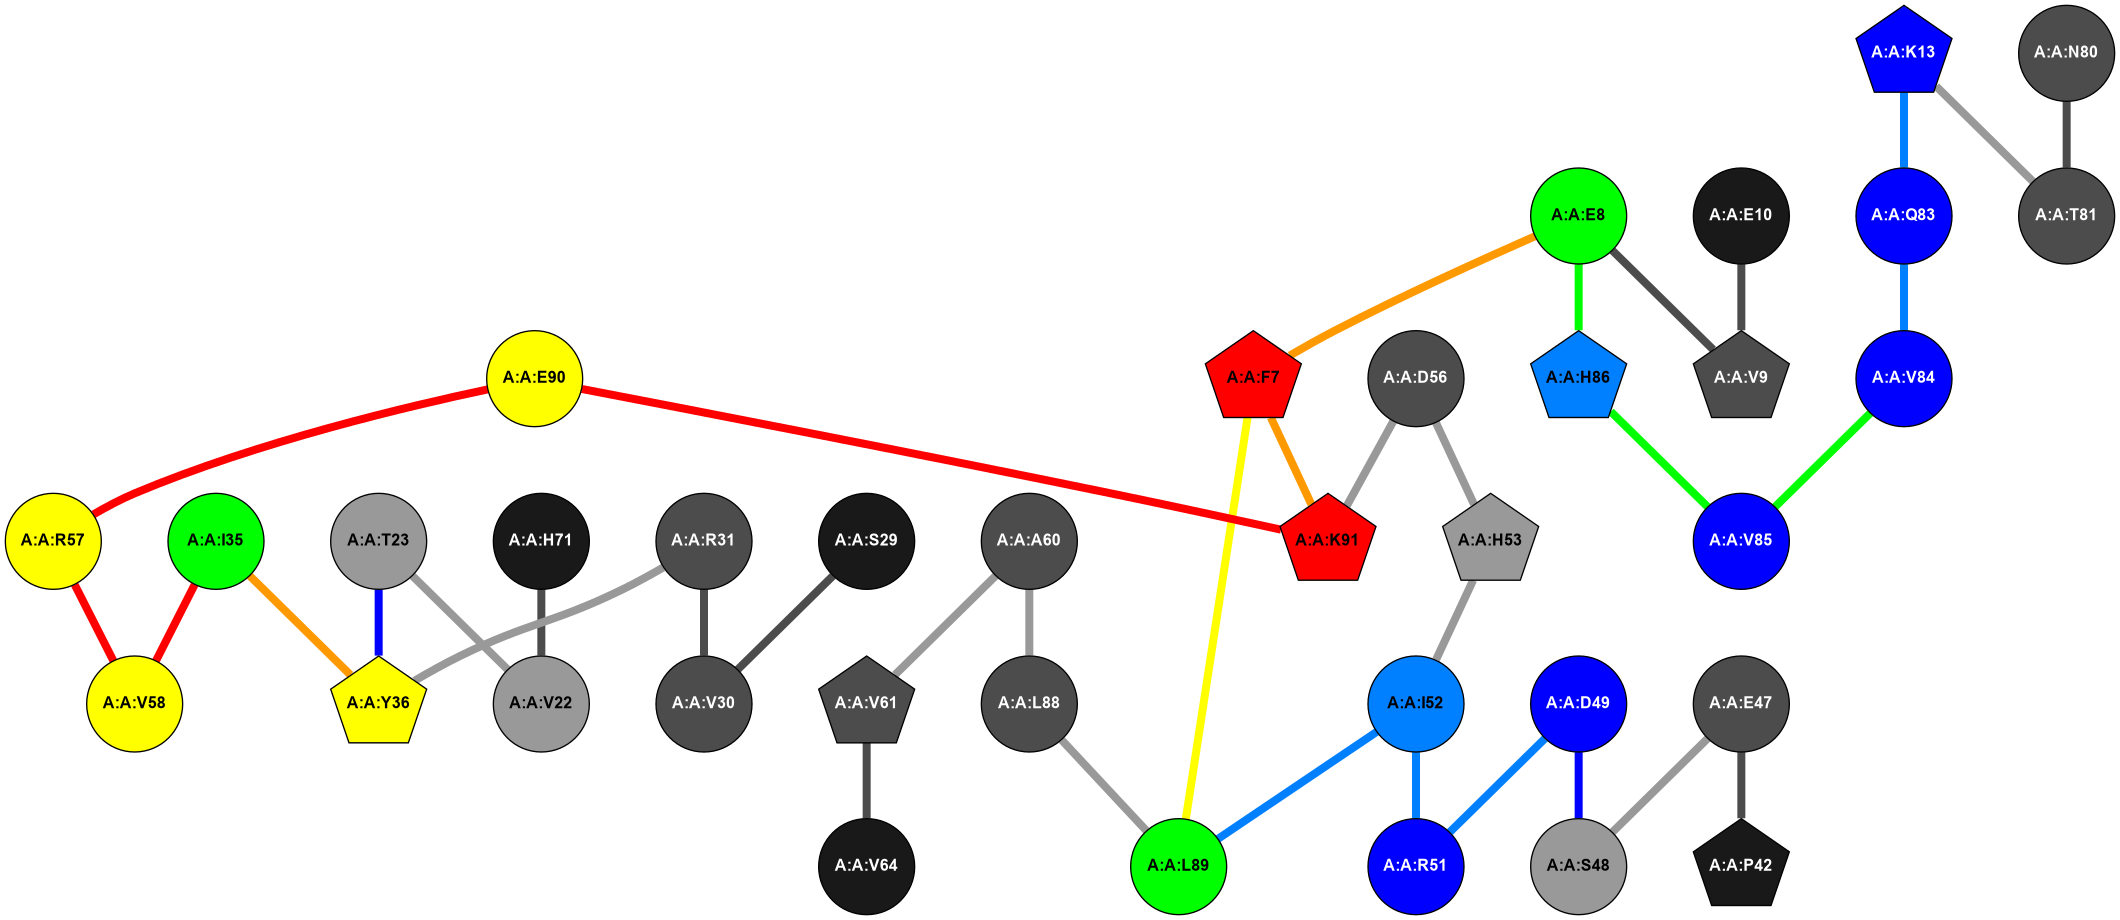
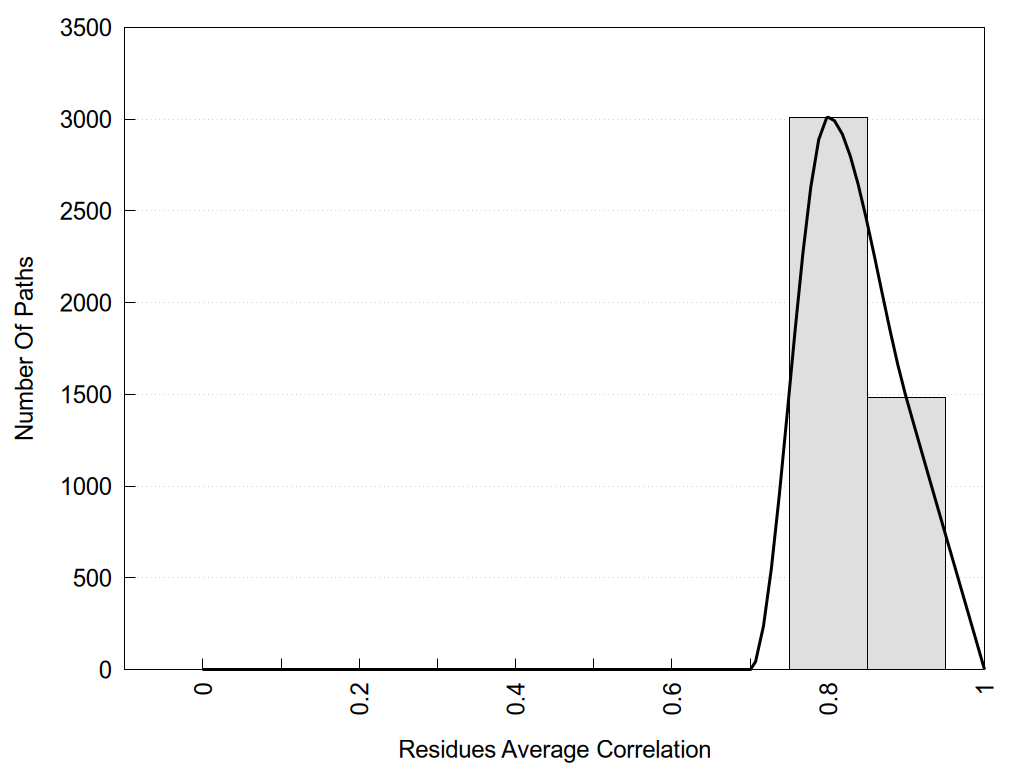
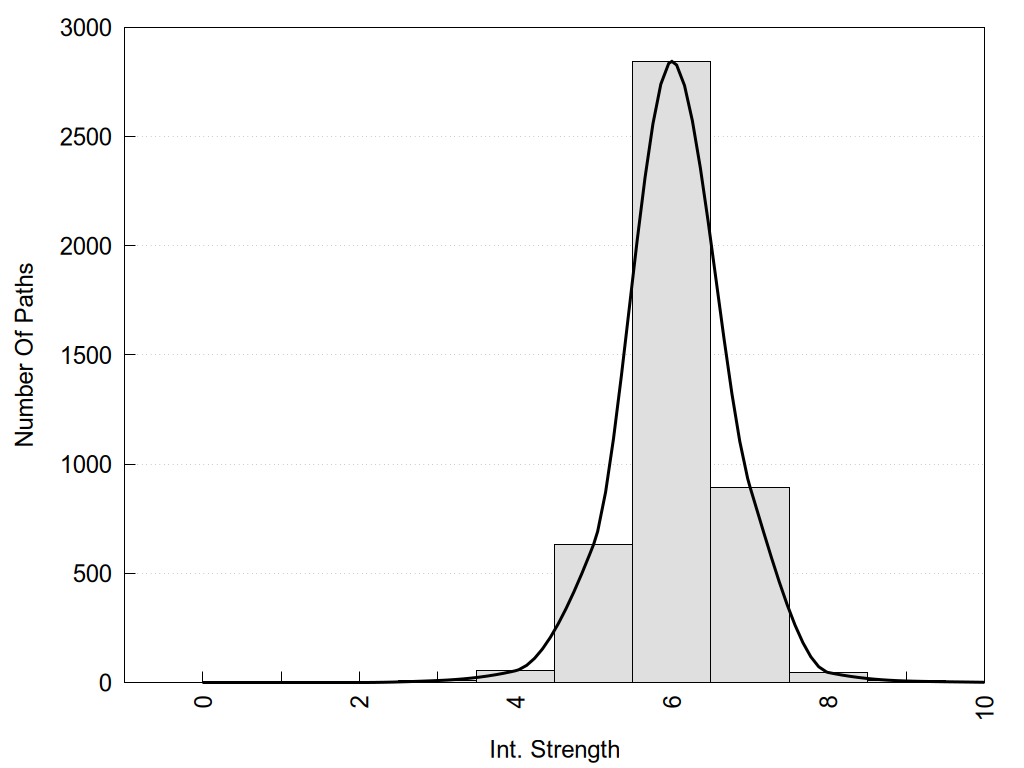
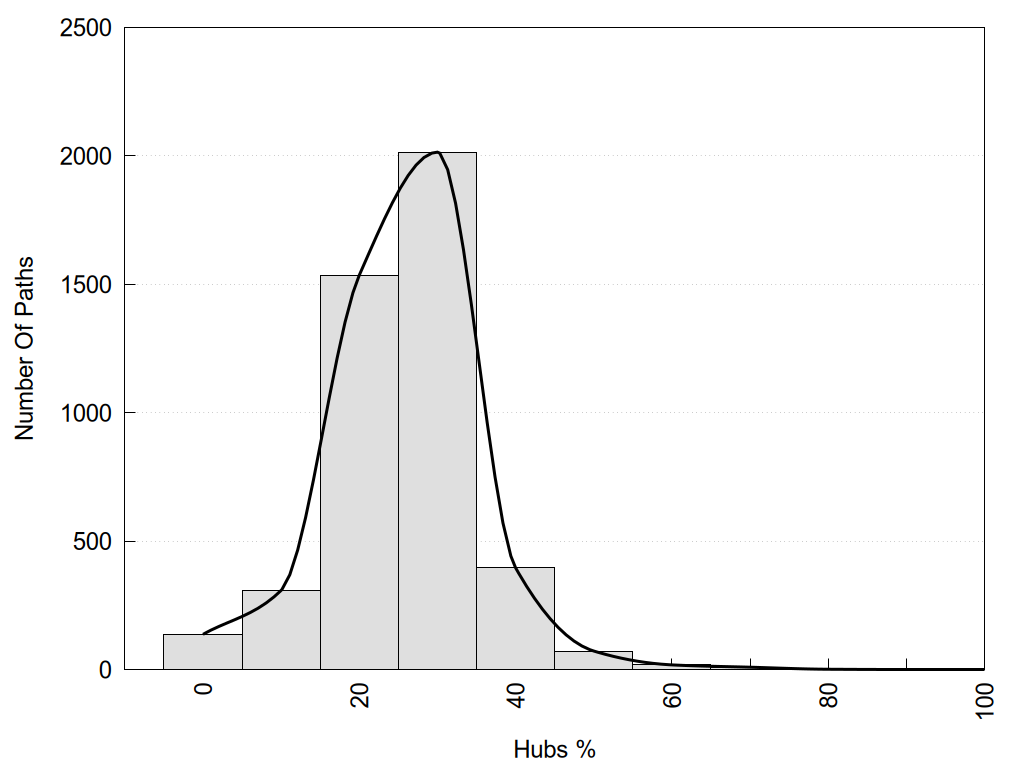
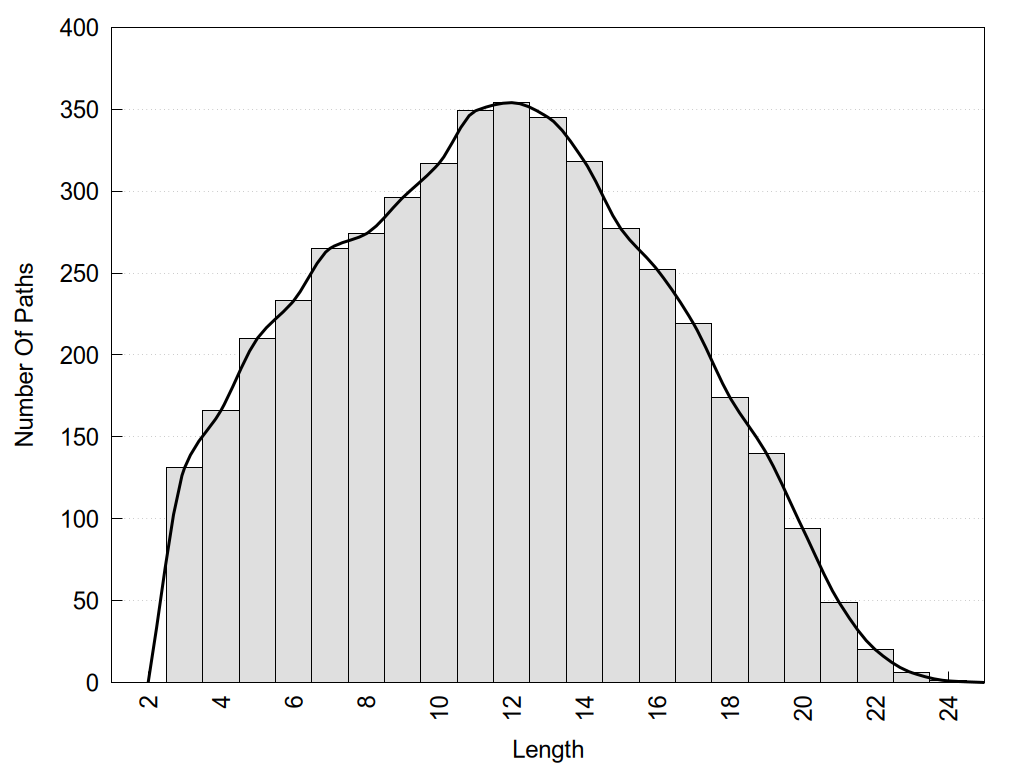
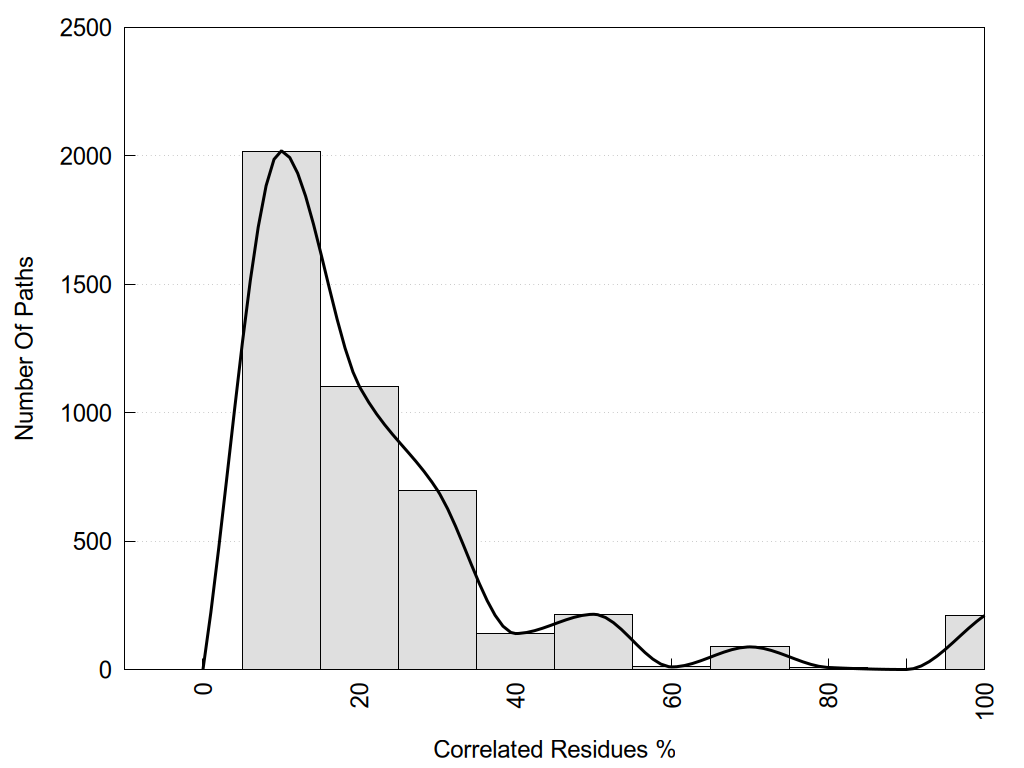
2D representation of the user filetered metapath and histograms of path distribution according to several parameters:
|
|
|
Details about the values in these tables can be found in the corresponding documentation page .
You can download a compressed (zip) file with all submitted structures, 3D outputs (as PyMol and VMD scripts) and numerical data files (as csv and plain text files). The zip bundle also contains an output manual explaining the meaning of all files and numerical data.